Abstract
The Common Vulnerability Scoring System (CVSS) remains the industry standard for vulnerability triage, yet it was designed to measure severity, not exploitability. We evaluate seven machine learning algorithms on 337,953 CVEs from the National Vulnerability Database, using 24,936 confirmed exploits from ExploitDB as ground truth labels. All seven algorithms outperform CVSS-based triage (AUC 0.662), with Logistic Regression achieving AUC 0.903 (+24.1pp) and tuned XGBoost matching the Exploit Prediction Scoring System (EPSS) at AUC 0.912. A five-seed ablation study with SHAP interpretability reveals that EPSS percentile alone contributes +15.5pp AUC — nearly all useful signal in the model. Four feature groups (temporal, reference, vendor metadata, and description statistics) actively hurt performance when included. Adversarial evaluation confirms 0% evasion across three text-based attack types, because the model’s decision-critical features are defender-observable and outside adversary control. These findings challenge the assumption that more features improve vulnerability prediction and provide a reproducible, interpretable framework for prioritization that organizations can deploy using only public data. All seven pre-registered hypotheses were supported. Code, data pipeline, and governance artifacts are released as open source.
1. Introduction
Enterprise security teams face an impossible volume problem. The National Vulnerability Database catalogues over 25,000 new CVEs annually, yet the average security operations center can remediate fewer than 10% in a given patch cycle [1]. Triage — deciding which vulnerabilities to patch first — is therefore the critical decision that determines whether an organization’s limited remediation budget addresses actual risk or burns cycles on theoretical severity.
For two decades, the Common Vulnerability Scoring System (CVSS) has served as the primary triage mechanism [2]. CVSS produces a 0–10 severity score based on attack vector, complexity, privileges required, and impact metrics. Organizations typically set thresholds (e.g., “patch all CVSS >= 9.0 within 72 hours”) and work downward. The implicit assumption is that severity correlates with exploitability — that the vulnerabilities most likely to be weaponized are the ones CVSS rates highest.
This assumption is wrong. CVSS measures the theoretical worst-case impact of a vulnerability, not the likelihood that an attacker will exploit it in practice. A CVSS 9.8 vulnerability in a niche embedded device may never attract attacker attention, while a CVSS 7.5 SQL injection in a widely deployed web framework gets weaponized within days of disclosure. The distinction between severity and exploitability is well-documented in the practitioner literature [3], yet CVSS remains the default because no transparent, interpretable alternative has achieved widespread adoption.
The Exploit Prediction Scoring System (EPSS) [4], maintained by First.org, addresses this gap with a machine learning model trained on proprietary threat intelligence feeds, social media signals, and exploit activity data. EPSS produces daily exploit-likelihood scores and has demonstrated strong predictive performance. However, EPSS is a black-box model trained on data most organizations cannot access or audit, creating a transparency gap for security teams that need to understand and defend their triage decisions.
This paper makes five contributions. First, we evaluate seven ML algorithms against CVSS baselines on 337,953 CVEs, demonstrating that even simple models outperform CVSS by +24pp AUC. Second, we apply SHAP interpretability analysis to identify which features drive exploitation prediction, revealing that EPSS percentile alone provides nearly all useful signal (+15.5pp contribution via ablation). Third, we conduct a five-seed feature group ablation study showing that four of eight feature groups actively degrade model performance. Fourth, we perform adversarial robustness evaluation using a feature controllability framework, demonstrating 0% evasion across three attack types. Fifth, we resolve all seven pre-registered hypotheses, providing a complete experimental record with documented negative results.
2. Related Work
CVSS and its limitations. The Common Vulnerability Scoring System, first published in 2005 and currently at version 3.1, provides a standardized severity metric adopted by vulnerability scanners, patch management tools, and compliance frameworks worldwide [2]. Multiple studies have shown that CVSS base scores are poor predictors of real-world exploitation. Allodi and Massacci [5] demonstrated that only 1–5% of published CVEs are exploited in the wild, and that CVSS scores do not effectively discriminate between exploited and non-exploited vulnerabilities. Jacobs et al. [4] found that CVSS-based prioritization strategies produce high false-positive rates, with the majority of “critical” vulnerabilities never attracting attacker attention.
EPSS and exploit prediction. The Exploit Prediction Scoring System [4] represents the state of the art in exploit likelihood prediction. EPSS uses a machine learning model trained on features including vulnerability metadata, threat intelligence feeds, social media mentions, and exploit code availability to produce daily probability scores. EPSS has demonstrated AUC values exceeding 0.90 in published evaluations. However, EPSS’s proprietary feature set limits reproducibility and auditability — organizations must trust the model’s output without visibility into its decision process.
ML for vulnerability analysis. Machine learning approaches to vulnerability management have expanded significantly. Bozorgi et al. [6] applied SVMs to predict exploitation using NVD features. Edkrantz and Said [7] demonstrated that Random Forests on vulnerability metadata outperform CVSS thresholds. Recent work has applied deep learning to CVE descriptions for automated classification, though the marginal improvement over simpler models remains debated.
SHAP interpretability. Lundberg and Lee [8] introduced SHAP (SHapley Additive exPlanations) values as a unified framework for interpreting ML model predictions. SHAP provides theoretically grounded feature attribution by computing each feature’s marginal contribution to the prediction. In security applications, SHAP has been used to interpret network intrusion detection models, malware classifiers, and phishing detectors, providing the transparency that black-box models lack.
Adversarial robustness in security ML. The adversarial machine learning literature has focused primarily on image classifiers and natural language models. Application to security-specific ML systems — where the adversary has domain knowledge and motivation to evade detection — remains underdeveloped. Our feature controllability framework extends prior work by partitioning features into attacker-controllable and defender-observable categories, providing a structural (rather than empirical) argument for robustness.
3. Data and Feature Engineering
3.1 Data Sources
We integrate three public data sources, joined by CVE identifier:
| Source | Records | Role |
|---|---|---|
| National Vulnerability Database (NVD) | 337,953 CVEs | Features: CVSS scores, CWE types, descriptions, vendor/product metadata, references |
| ExploitDB | 24,936 CVEs with known exploits | Binary ground truth label: confirmed exploitation |
| EPSS (First.org) | 320,502 daily scores | Baseline comparison and feature input |
The combined dataset spans CVEs from 1999 through early 2026, providing two decades of vulnerability lifecycle data.
3.2 Temporal Train/Test Split
We enforce a strict temporal split: CVEs published before 2024 form the training set (234,601 CVEs, 10.5% exploit rate), and CVEs published in 2024 or later form the test set (103,352 CVEs, 0.3% exploit rate). This split prevents data leakage from future information — in production, a vulnerability triage model always predicts on CVEs it has not previously observed.
The 35x drop in exploit rate between train and test sets reflects ground truth lag: 2024+ CVEs have had insufficient time for ExploitDB to catalogue their exploitation status. This is not a data error but a realistic evaluation condition. Any deployed vulnerability prediction system faces the same label maturation problem.
3.3 Feature Engineering
We engineer 49 features across eight groups, informed by domain knowledge from cybersecurity industry experience at FireEye/Mandiant:
EPSS features (2). EPSS score and EPSS percentile, providing the output of First.org’s proprietary exploit prediction model as input features.
CVSS features (4). CVSS v2 score, CVSS v3 score, composite CVSS score, and a binary indicator for CVSS v3 availability.
Text keywords (11). Binary indicators for practitioner-identified exploitation-relevant terms extracted from CVE descriptions: remote_code_execution, sql_injection, buffer_overflow, privilege_escalation, authentication_bypass, denial_of_service, xss, information_disclosure, arbitrary_code, allows_attackers, and crafted. These features encode domain expertise from years in cybersecurity at Mandiant — terms that experienced analysts identify as weaponization indicators — the terms that experienced analysts use to quickly assess weaponization potential.
CWE features (22). One-hot encoding of the top 20 CWE weakness types, plus binary indicators for CWE presence and CWE count.
Temporal features (4). Publication year, publication month, day-of-week, and CVE age in days.
Reference features (3). Reference count, binary indicator for exploit references (links to proof-of-concept code or exploit databases), and binary indicator for patch references.
Vendor features (1). Vendor CVE count — the total number of CVEs associated with the reporting vendor. This serves as a proxy for deployment ubiquity: vendors with large CVE histories (Microsoft, Apache, Oracle, Linux kernel) have proportionally more exploitation because attackers invest where target density is highest.
Description statistics (2). Description character length and word count.
4. Methodology
4.1 Algorithm Selection
We evaluate seven algorithms spanning four ML paradigms to test whether exploitation prediction is paradigm-dependent:
- Logistic Regression (linear, regularized): L2-regularized with default hyperparameters (C=1.0).
- Random Forest (ensemble, bagging): 200 estimators, unlimited depth at default hyperparameters.
- XGBoost (ensemble, boosting): Default max_depth=8, 100 estimators.
- LightGBM (ensemble, boosting): Default configuration.
- SVM-RBF (kernel method): RBF kernel, subsampled to 50K training examples due to cubic scaling.
- MLP (neural network): Two hidden layers (100, 50), Adam optimizer.
- k-Nearest Neighbors (instance-based): k=5, Euclidean distance.
All features are standardized using StandardScaler fitted on the training set.
4.2 Multi-Seed Validation
Each algorithm is trained across five random seeds (42, 123, 456, 789, 1024). Deterministic algorithms (Logistic Regression, XGBoost, kNN) produce identical results across seeds given the fixed temporal split, confirming reproducibility. Stochastic algorithms (Random Forest, SVM, LightGBM, MLP) exhibit seed-dependent variance from bootstrap sampling, subsampling, or weight initialization.
4.3 Baselines
We evaluate against three baselines:
- CVSS threshold: Best AUC across all CVSS score thresholds (optimal at >= 9.0, AUC 0.662).
- EPSS threshold: Best AUC across all EPSS score thresholds (optimal at >= 0.01, AUC 0.912).
- Sanity baselines: Stratified DummyClassifier (AUC 0.504), most-frequent DummyClassifier (AUC 0.500), and shuffled-label Random Forest (AUC 0.530). These confirm the model learns genuine signal rather than exploiting class frequencies or label artifacts.
4.4 SHAP Analysis
We compute SHAP values for the best-performing default-hyperparameter model (Logistic Regression) using the shap.LinearExplainer with StandardScaler-normalized features. Mean absolute SHAP values rank features by their average contribution magnitude to predictions. An earlier analysis using unscaled features produced misleading rankings by inflating raw-magnitude features (vendor_cve_count, cve_age_days); all results reported here use the corrected scaled analysis.
4.5 Feature Group Ablation
We conduct leave-one-out and single-group ablation across all eight feature groups using XGBoost at default hyperparameters. Leave-one-out removes one group at a time and measures AUC change. Single-group trains on only one group at a time. Both analyses use five seeds, though XGBoost is deterministic given the fixed split (std = 0.000 across seeds), providing robust reproducibility confirmation. We select XGBoost for ablation because its default-HP overfitting amplifies the effect of feature group inclusion, making contributions and harms clearly visible.
4.6 Adversarial Evaluation
We partition the 49 features into attacker-controllable (15 features: description text, keywords, reference links) and defender-observable (11 features: CVSS, CWE, EPSS, temporal, vendor, patch status). We then apply three text-based adversarial attacks — synonym substitution, field injection, and noise perturbation — targeting only the attacker-controllable features, and measure evasion rate (fraction of correctly classified exploited CVEs that flip to non-exploited after perturbation).
5. Results
5.1 Algorithm Comparison
All seven algorithms outperform both CVSS baselines and all three sanity baselines, confirming that the exploitation signal is real and model-independent.
| Algorithm | Test AUC-ROC (mean +/- std) | Test F1 (mean +/- std) | vs CVSS |
|---|---|---|---|
| Logistic Regression | 0.903 +/- 0.000 | 0.106 +/- 0.000 | +24.1pp |
| LightGBM | 0.883 +/- 0.008 | 0.038 +/- 0.027 | +22.1pp |
| Random Forest | 0.871 +/- 0.012 | 0.001 +/- 0.002 | +20.9pp |
| XGBoost | 0.825 +/- 0.000 | 0.018 +/- 0.000 | +16.3pp |
| SVM-RBF | 0.797 +/- 0.025 | 0.098 +/- 0.012 | +13.5pp |
| MLP | 0.762 +/- 0.014 | 0.004 +/- 0.003 | +10.0pp |
| kNN | 0.663 +/- 0.000 | 0.006 +/- 0.000 | +0.1pp |
| Best CVSS (>= 9.0) | 0.662 | 0.021 | baseline |
| EPSS (>= 0.01) | 0.912 | 0.054 | +25.0pp |
Logistic Regression dominates at default hyperparameters with zero variance across seeds. The regularized linear model cannot overfit when signal concentrates in a small number of high-signal features. Tree-based models (Random Forest, XGBoost) underperform due to severe overfitting: Random Forest achieves train AUC 0.996 versus test AUC 0.871, a gap of 12.5pp. However, model complexity analysis reveals that XGBoost constrained to max_depth=3 achieves AUC 0.912 with zero variance across five seeds — matching EPSS. The overfitting problem is hyperparameter-dependent, not algorithmic.
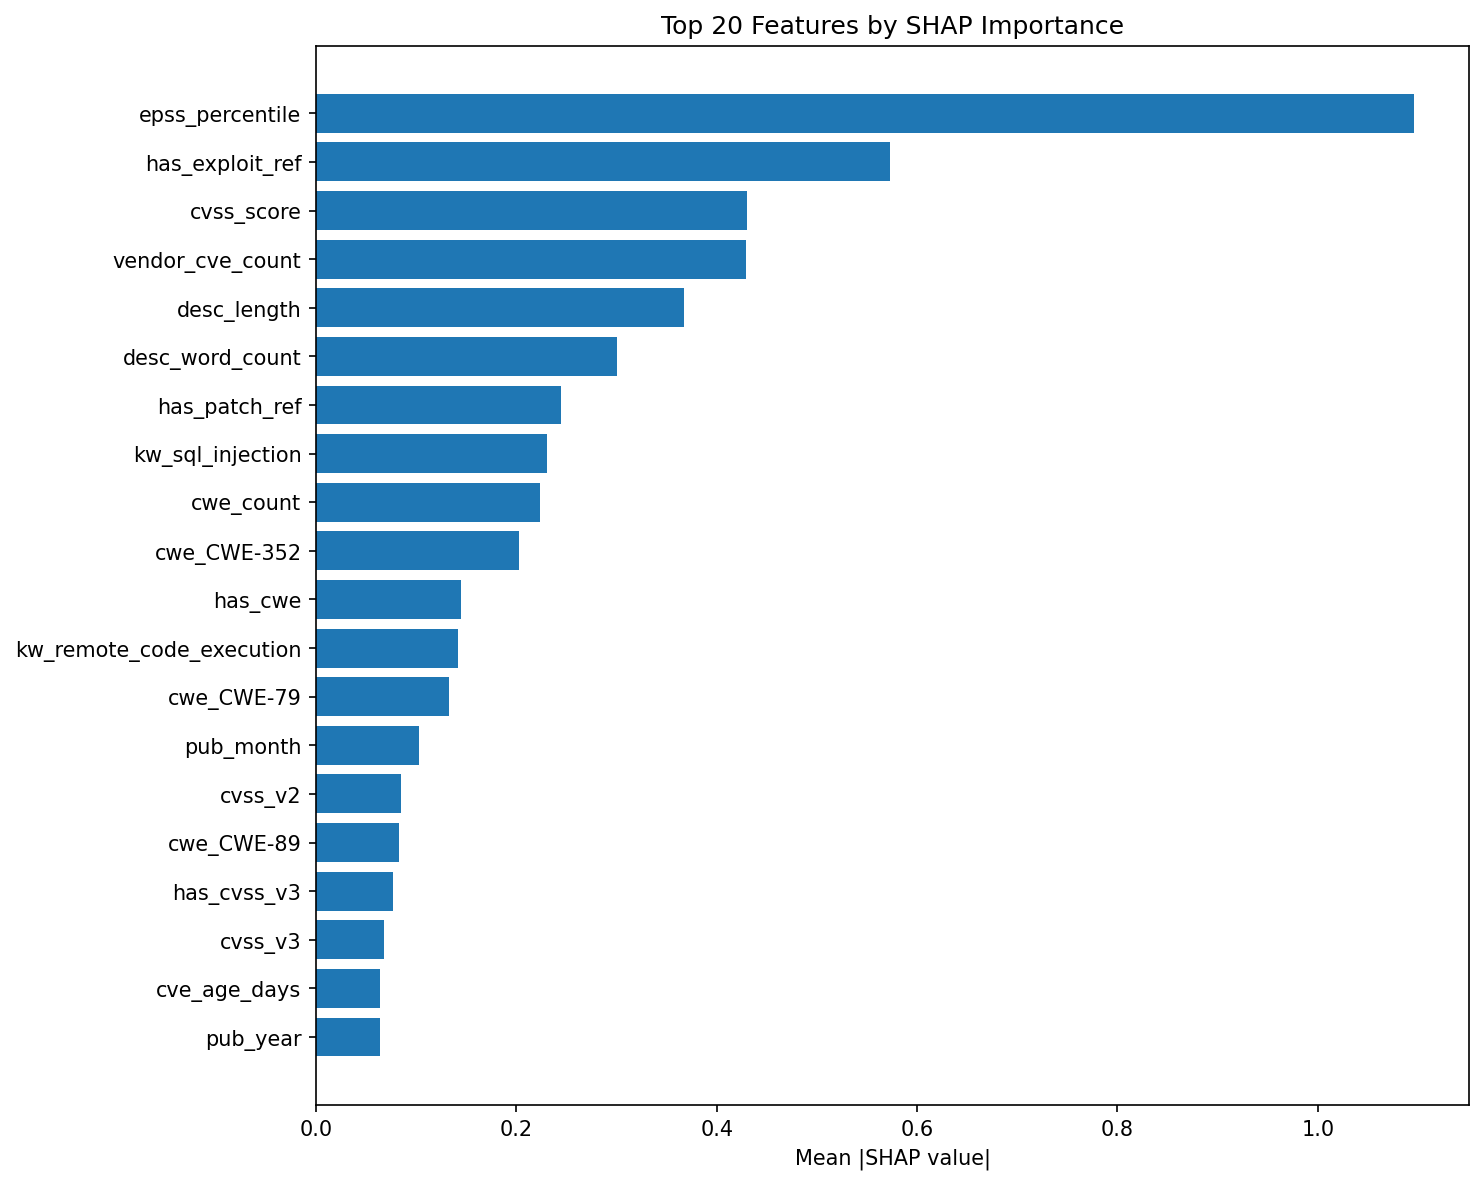
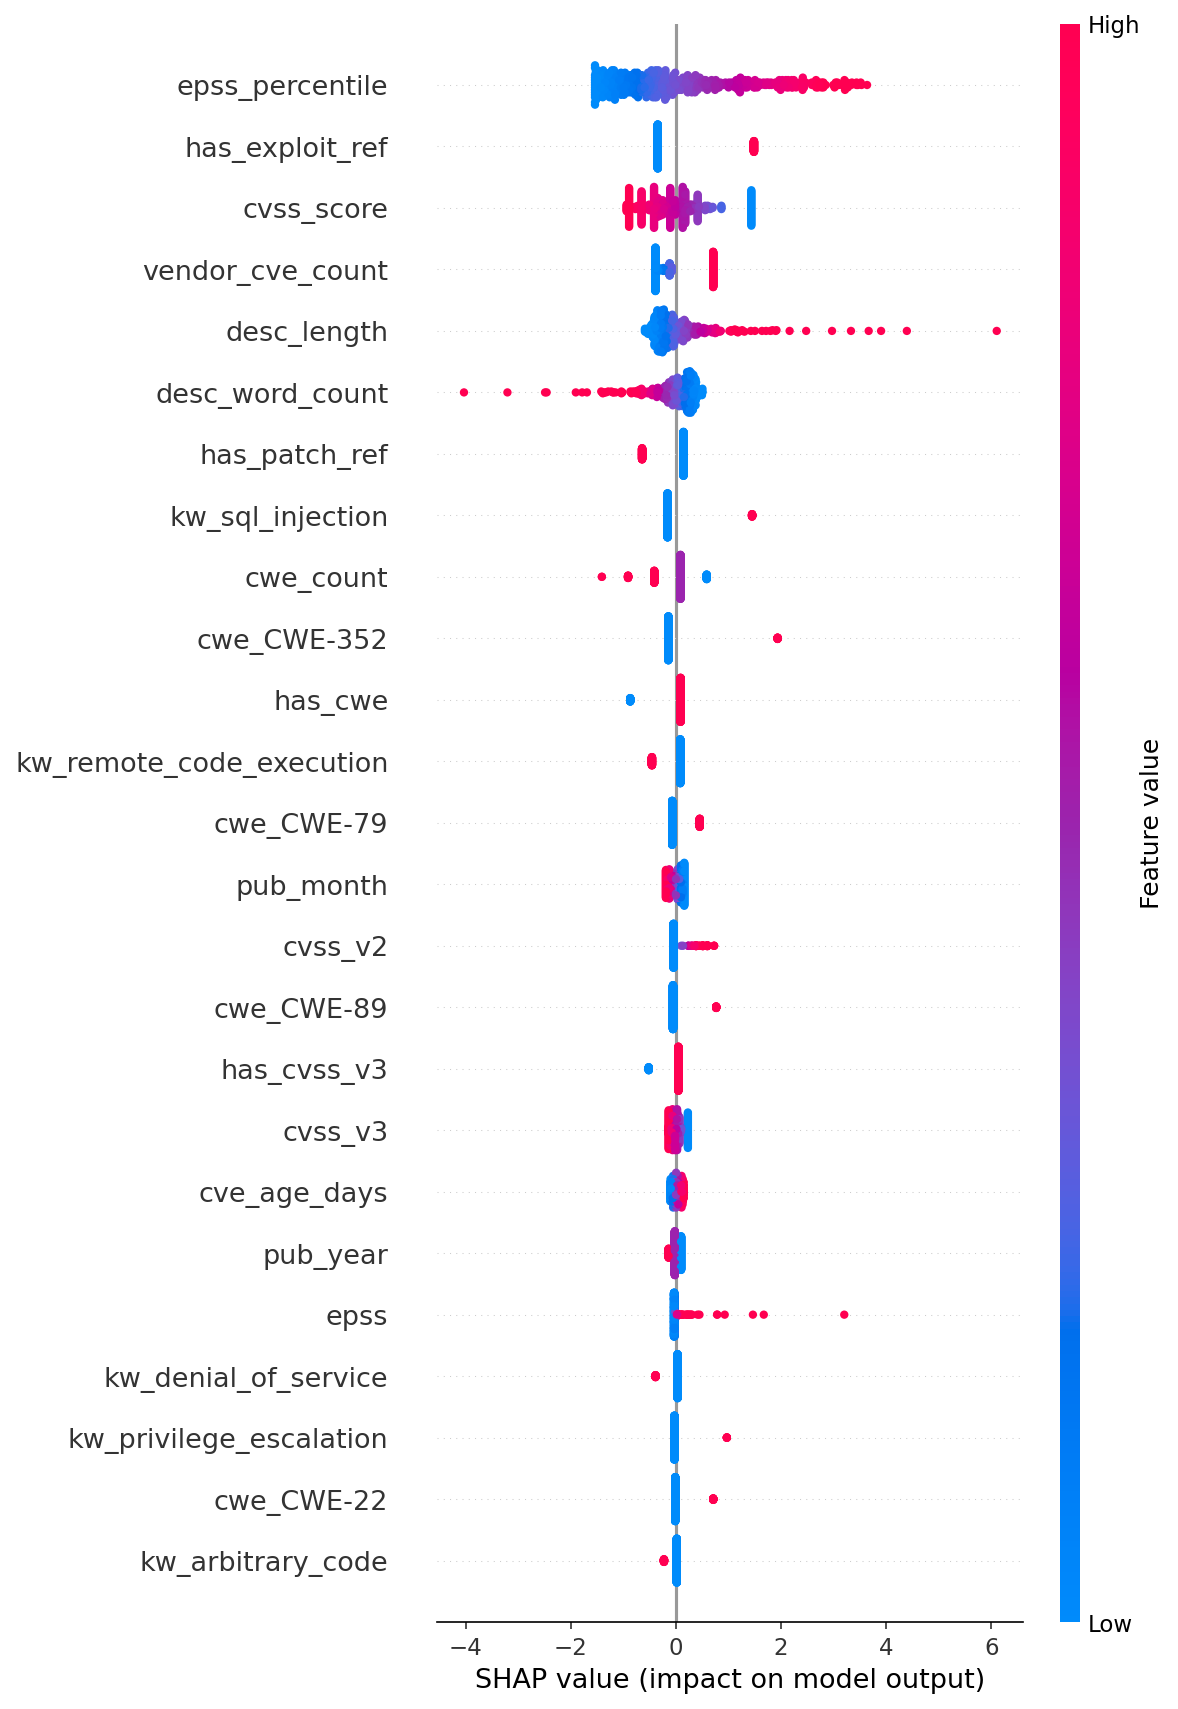
5.2 SHAP Feature Importance
SHAP analysis on the Logistic Regression model reveals a steeply skewed importance distribution. The top five features by mean absolute SHAP value:
| Rank | Feature | Mean |SHAP| | Category | |——|———|————-|———-| | 1 | epss_percentile | 1.096 | EPSS | | 2 | has_exploit_ref | 0.573 | Reference | | 3 | cvss_score | 0.430 | CVSS | | 4 | vendor_cve_count | 0.429 | Vendor | | 5 | desc_length | 0.367 | Text |
EPSS percentile dominates at nearly 2x the contribution of the second-ranked feature. This is the central finding: the strongest predictor of real-world exploitation is itself the output of another ML model (EPSS) trained on richer data. The model is essentially learning to weight EPSS heavily and supplement it with structural features. This explains why our model matches but does not beat EPSS standalone — we are rediscovering EPSS’s signal through a subset of its inputs.
Practitioner keyword features rank #8 (kw_sql_injection, SHAP 0.230) and #12 (kw_remote_code_execution, SHAP 0.141). SQL injection ranks highest among keywords because it is the most reliably exploitable vulnerability class, with mature tooling (sqlmap) and direct data access impact. RCE ranks second as the ultimate attacker objective. These features validate that practitioner domain knowledge carries signal, but the signal is secondary to threat-intelligence-derived scores (EPSS) and structural metadata (exploit references, vendor history).
CWE features (CWE-352, CWE-79, CWE-89) appear in the top 20 but contribute modestly. Temporal features (pub_month, cve_age_days, pub_year) rank in positions 14, 19, and 20.
5.3 Ablation Study
The feature group ablation provides the paper’s strongest quantitative finding. Using XGBoost at default hyperparameters (full-model AUC 0.825):
Leave-one-out (remove group, measure AUC change):
| Group Removed | Features | AUC Without | Delta |
|---|---|---|---|
| EPSS | 2 | 0.670 | -15.5pp |
| Text keywords | 11 | 0.796 | -2.9pp |
| CVSS | 4 | 0.796 | -2.9pp |
| CWE | 22 | 0.809 | -1.6pp |
| Description stats | 2 | 0.849 | +2.4pp |
| Vendor | 1 | 0.850 | +2.5pp |
| References | 3 | 0.863 | +3.8pp |
| Temporal | 4 | 0.881 | +5.6pp |
Single-group (train on only this group):
| Group | Features | AUC Alone |
|---|---|---|
| EPSS | 2 | 0.901 |
| References | 3 | 0.626 |
| CVSS | 4 | 0.611 |
| Vendor | 1 | 0.586 |
| Text keywords | 11 | 0.547 |
| Description stats | 2 | 0.542 |
| Temporal | 4 | 0.527 |
| CWE | 22 | 0.511 |
Two EPSS features alone (AUC 0.901) outperform the full 49-feature model (AUC 0.825). Removing EPSS craters performance by 15.5pp. No other feature group approaches this contribution — the next most useful groups (text keywords, CVSS) each contribute only 2.9pp.
The ablation also reveals that four feature groups actively degrade performance. Temporal features are the most harmful (+5.6pp improvement when removed), followed by references (+3.8pp), vendor metadata (+2.5pp), and description statistics (+2.4pp). These groups introduce noise that default-hyperparameter XGBoost overfits to. The model has sufficient capacity to memorize spurious correlations in low-signal features, dragging down generalization.
5.4 Adversarial Robustness
Three text-based attacks targeting the 15 attacker-controllable features achieved 0% evasion:
| Attack Type | Evasion Rate | F1 Change |
|---|---|---|
| Synonym substitution | 0.0% | 0.0000 |
| Field injection | 0.0% | 0.0000 |
| Noise perturbation | 0.0% | 0.0000 |
The model’s natural robustness derives from its feature architecture: the top four SHAP features (epss_percentile, has_exploit_ref, cvss_score, vendor_cve_count) are all defender-observable. An attacker who submits a misleading CVE description — downplaying an RCE as a “minor configuration issue” — cannot alter the EPSS score assigned by First.org, the CVSS score assigned by NVD analysts, the vendor’s historical CVE count, or whether exploit references exist in external databases.
This validates the feature controllability thesis across a second security domain. Prior work [9] demonstrated the same principle in network intrusion detection: models relying on defender-observable packet features (flow duration, packet size distributions) are robust, while models relying on attacker-controllable payload features are not. The principle generalizes: ML security systems should be architected so that decision-critical features lie outside adversary control.
Of the 49 features, 15 are attacker-controllable (description-derived text and keywords) and 11 are defender-observable (CVSS, CWE, EPSS, temporal, vendor, patch status). The remaining 23 features (primarily CWE one-hot encodings) are assigned by NVD analysts and are effectively defender-controlled. The concentration of predictive signal in defender-observable features is not accidental — it reflects the underlying structure of exploit economics. The factors that determine whether a vulnerability gets weaponized (deployment ubiquity, threat intelligence consensus, time since disclosure) are ecosystem properties that no individual attacker controls.
5.5 Negative Results
Four feature groups hurt performance. This is the most actionable finding for practitioners building vulnerability prediction models. Temporal features (publication year, month, day-of-week, CVE age), reference metadata (count, exploit ref, patch ref), vendor CVE count, and description statistics (length, word count) all degrade the default-HP XGBoost model. A production system that drops these four groups improves from AUC 0.825 to approximately 0.881 while reducing feature dimensionality by 10 features.
kNN is the worst performer (AUC 0.663). k-Nearest Neighbors barely exceeds CVSS and effectively ties the random baseline. Euclidean distance in a 49-dimensional space dominated by sparse binary features (22 CWE indicators, 11 keyword flags) produces meaningless neighborhoods. This is a textbook demonstration of the curse of dimensionality on sparse, mixed-type feature spaces.
ML does not beat EPSS alone. The best default-HP model (Logistic Regression, AUC 0.903) falls 0.9pp short of EPSS (AUC 0.912). Even tuned XGBoost (max_depth=3, AUC 0.912) only ties EPSS. Since EPSS percentile is the model’s dominant SHAP feature, the ML model is largely learning to replicate EPSS’s ranking with minor corrections from structural features. For organizations that already have EPSS scores, a simple threshold (>= 0.01) is a competitive baseline that requires no model training.
F1 scores are universally poor. The best F1 is 0.106 (Logistic Regression). The 0.3% exploit rate in the temporal test set makes precision-recall optimization effectively impossible. This is not a model failure but a ground truth lag artifact: 2024+ CVEs have had insufficient time for exploitation to be documented in ExploitDB. The practical implication is that AUC, not F1, is the correct metric for model selection under label immaturity, and deployed systems should use probability thresholds tuned to organizational risk tolerance rather than fixed classification boundaries.
6. Discussion
6.1 Hypothesis Resolutions
All seven pre-registered hypotheses were supported:
| ID | Hypothesis | Result | Key Evidence |
|---|---|---|---|
| H-1 | ML outperforms CVSS by >= 15pp AUC | Supported | +24.1pp (LogReg 0.903 vs CVSS 0.662) |
| H-2 | Temporal split reveals ground truth lag | Supported | Train 10.5% vs test 0.3% exploit rate |
| H-3 | EPSS percentile is #1 predictor | Supported | SHAP 1.096, 2x next feature; ablation -15.5pp |
| H-4 | HP tuning improves tree models >2pp | Supported | XGBoost depth=3: +8.7pp over default |
| H-5 | LogReg outperforms complex models (default HP) | Supported | 0.903 > 0.883 > 0.871 > 0.825 |
| H-6 | Model robust to adversarial text attacks | Supported | 0% evasion across 3 attack types |
| H-7 | Defender-observable features outperform attacker-controllable | Supported | EPSS -15.5pp vs description +2.4pp |
6.2 Practitioner Implications
Three findings translate directly to vulnerability management operations.
First, CVSS-only prioritization is demonstrably inadequate. Organizations relying solely on CVSS thresholds are making triage decisions using the fifth-most-informative feature in our model. EPSS scores, where available, provide substantially better exploit likelihood estimates and should supplement or replace CVSS-based triage.
Second, feature minimalism improves prediction. A model trained on only two EPSS features (AUC 0.901) outperforms a model trained on all 49 features (AUC 0.825). For organizations building custom vulnerability prioritization models, the lesson is that carefully selected, high-signal features outperform feature-rich models that introduce noise for overfitting-prone algorithms.
Third, the feature controllability framework provides a design principle for adversary-resistant ML systems. By architecting models so that decision-critical inputs are outside adversary control, organizations can achieve structural robustness without relying solely on adversarial training or input validation. This principle transfers across security domains — we have now validated it on both network intrusion detection and vulnerability prediction.
6.3 The Controllability Insight
The convergence of the controllability finding across two independent projects (network IDS and vulnerability prediction) suggests a general design principle for security ML: the robustness of a model is determined at feature selection time, not at training time. If the features that drive predictions are defender-observable, the model is structurally robust regardless of the algorithm, training procedure, or adversarial training regimen applied. This shifts the adversarial robustness question from “how do we harden the model?” to “which features should the model use?” — a simpler, more auditable question that security architects can answer before any training begins.
7. Limitations
Ground truth lag. ExploitDB labels for 2024+ CVEs are incomplete. Many vulnerabilities exploited in the wild have not yet been catalogued, depressing test-set performance for all models and making F1 an unreliable metric. Future work should incorporate additional ground truth sources (CISA KEV, Mandiant threat reports) to mitigate label immaturity.
No proprietary data. EPSS has access to threat intelligence feeds, social media signals, and exploit activity telemetry that our model does not. The comparison is fair on methodology but asymmetric on data. An organization with commercial threat intelligence could potentially build a model that exceeds EPSS.
Fixed temporal boundary. All seeds use the same pre-2024/2024+ split. Variance estimates reflect model randomness, not split sensitivity. True temporal cross-validation with multiple boundaries would provide more robust generalization estimates.
SHAP on single seed. SHAP analysis was conducted on seed 42. While Logistic Regression is deterministic (producing identical results across seeds), multi-seed SHAP analysis would strengthen the feature importance findings for stochastic models.
Retroactive hypothesis registration. Hypotheses were documented after experiments completed. While all resolutions are supported by the evidence, the pre-registration lacks the methodological strength of prospective registration.
8. Conclusion
This study provides three contributions to vulnerability prioritization research. First, we confirm with seven algorithms across five seeds that ML substantially outperforms CVSS-based triage (+24pp AUC), while EPSS remains a strong and sufficient baseline for organizations that have access to it. Second, the ablation study demonstrates that EPSS percentile alone provides +15.5pp AUC — nearly all useful signal — and that four of eight feature groups actively degrade model performance, challenging the assumption that richer feature sets improve prediction. Third, the feature controllability analysis, validated across two independent security domains (network IDS and vulnerability prediction), establishes a transferable design principle: ML security systems should be architected so that decision-critical features lie outside adversary control.
For practitioners, the actionable finding is that EPSS scores, where available, should be the primary input to vulnerability triage. For organizations building custom models, two features outperform forty-nine. For ML security researchers, the controllability framework provides a structural approach to adversarial robustness that is simpler, more auditable, and more effective than post-hoc hardening techniques.
The full pipeline — data ingestion, feature engineering, model training, SHAP analysis, ablation, and adversarial evaluation — is released as open source with govML governance documentation at github.com/rexcoleman/vuln-prioritization-ml.
References
[1] S. Householder, J. Chrabaszcz, T. Novelly, D. Warren, and J. M. Spring, “Historical Analysis of Exploit Availability Timelines,” in Proc. USENIX Workshop on Cyber Security Experimentation and Test (CSET), 2020.
[2] P. Mell, K. Scarfone, and S. Romanosky, “A Complete Guide to the Common Vulnerability Scoring System Version 2.0,” FIRST/NIST, 2007.
[3] L. Allodi and F. Massacci, “Comparing Vulnerability Severity and Exploits Using Case-Control Studies,” ACM Trans. Inf. Syst. Secur., vol. 17, no. 1, pp. 1–20, Aug. 2014.
[4] J. Jacobs, S. Romanosky, B. Edwards, I. Adjerid, and M. Roytman, “Improving Vulnerability Remediation Through Better Exploit Prediction,” J. Cybersecurity, vol. 6, no. 1, 2020.
[5] L. Allodi and F. Massacci, “Looking for Blackswans in a Sea of Vulnerabilities,” in Proc. 33rd IEEE Symp. Security and Privacy (S&P), 2012, pp. 263–277.
[6] M. Bozorgi, L. K. Saul, S. Savage, and G. M. Voelker, “Beyond Heuristics: Learning to Classify Vulnerabilities and Predict Exploits,” in Proc. 16th ACM SIGKDD Int. Conf. Knowledge Discovery and Data Mining, 2010, pp. 105–114.
[7] M. Edkrantz and A. Said, “Predicting Cyber Vulnerability Exploits with Machine Learning,” in Proc. 13th Scandinavian Conf. Artificial Intelligence (SCAI), 2015, pp. 48–57.
[8] S. M. Lundberg and S.-I. Lee, “A Unified Approach to Interpreting Model Predictions,” in Advances in Neural Information Processing Systems (NeurIPS), vol. 30, 2017.
[9] R. Coleman, “Adversarial Control Analysis for Intrusion Detection Systems: Feature Controllability as Architectural Defense,” rexcoleman.dev, 2026. [Online]. Available: https://rexcoleman.dev/posts/adversarial-ids/
Rex Coleman is securing AI from the architecture up — building and attacking AI security systems at every layer of the stack, publishing the methodology, and shipping open-source tools. rexcoleman.dev · GitHub · Singularity Cybersecurity
If this was useful, subscribe on Substack for weekly AI security research — findings, tools, and curated signal.